JavaScript and memory leaks
Credits: This tutorial is written by Volkan. He runs the site Sarmal.com, a bilingual site featuring all his work, products, services, and up-to-date profile information in English and Turkish.
If you are developing client-side re-usable scripting objects, sooner or later you will find yourself spotting out memory leaks. Chances are that your browser will suck memory like a sponge and you will hardly be able to find a reason why your lovely DHTML navigation's responsiveness decreases severely after visiting a couple of pages within your site.
A Microsoft developer Justing Rogers has described IE leak patterns in his excellent article.
In this article, we will review those patterns from a slightly different perspective and support it with diagrams and memory utilization graphs. We will also introduce several subtler leak scenarios. Before we begin, I strongly recommend you to read that article if you have not already read.
 Why does the memory leak?
The problem of memory leakage is not just limited to Internet Explorer. Almost any browser (including but not limited to Mozilla, Netscape and Opera) will leak memory if you provide adequate conditions (and it is not that hard to do so, as we will see shortly). But (in my humble opinion, ymmv etc.) Internet Explorer is the king of leakers.
Don't get me wrong. I do not belong to the crowd yelling "Hey IE has memory leaks, checkout this new tool [link-to-tool] and see for yourself". Let us discuss how crappy Internet Explorer is and cover up all the flaws in other browsers".
Each browser has its own strengths and weaknesses. For instance, Mozilla consumes too much of memory at initial boot, it is not good in string and array operations; Opera may crash if you write a ridiculously complex DHTML script which confuses its rendering engine.
Although we will be focusing on the memory leaking situations in Internet Explorer, this discussion is equally applicable to other browsers.
 A simple beginning
Let us begin with a simple example:
[Exhibit 1 - Memory leaking insert due to inline script]

<html>
<head>
<script type="text/javascript">
    function LeakMemory(){
        var parentDiv =
             document.createElement("<div onclick='foo()'>");

        parentDiv.bigString = new Array(1000).join(
                              new Array(2000).join("XXXXX"));
    }
</script>
</head>
<body>
<input type="button"
       value="Memory Leaking Insert" onclick="LeakMemory()" />
</body>
</html>
The first assignment parentDiv=document.createElement(...); will create a div element and create a temporary scope for it where the scripting object resides. The second assignment parentDiv.bigString=... attaches a large object to parentDiv. When LeakMemory() method is called, a DOM element will be created within the scope of this function, a very large object will be attached to it as a member property and the DOM element will be de-allocated and removed from memory as soon as the function exits, since it is an object created within the local scope of the function.
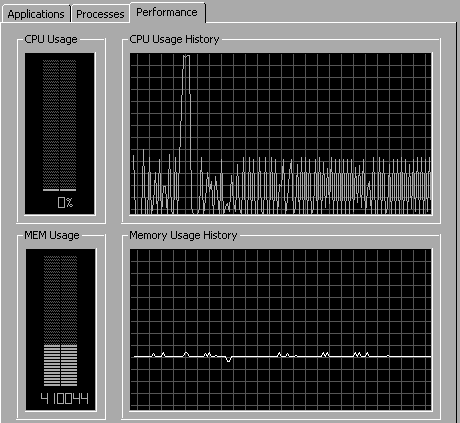
When you run the example and click the button a few times, your memory graph will probably look like this:

 Increasing the frequency
No visible leak huh? What if we do this a few hundred times instead of twenty, or a few thousand times? Will it be the same? The following code calls the assignment over and over again to accomplish this goal:
[Exhibit 2 - Memory leaking insert (frequency increased) ]

<html>
<head>
<script type="text/javascript">
    function LeakMemory(){
        for(i = 0; i < 5000; i++){
            var parentDiv =
               document.createElement("<div onClick='foo()'>");
        }
    }
</script>
</head>
<body>
<input type="button"
       value="Memory Leaking Insert" onclick="LeakMemory()" />
</body>
</html>
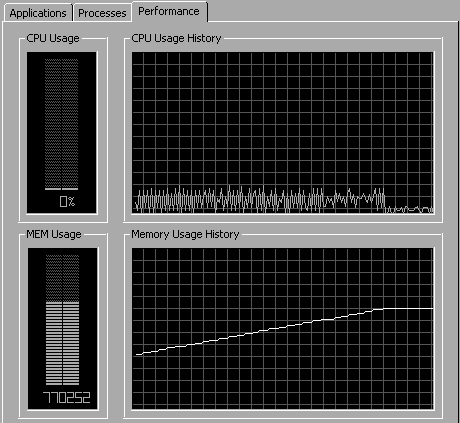
And here follows the corresponding graph:

The ramp in the memory usage indicates leak in memory. The horizontal line (the last 20 seconds) at the end of the ramp is the memory after refreshing the page and loading another (about:blank) page. This shows that the leak is an actual leak and not a pseudo leak. The memory will not be reclaimed unless the browser window and other dependant windows if any are closed.
Assume you have a dozen pages that have similar leakage graph. After a few hours, you may want to restart your browser (or even your PC) because it just stops responding. The naughty browser is eating up all your resources. However, this is an extreme case because Windows will increase the virtual memory size as soon as your memory consumption reaches a certain level.
This is not a pretty scenario. Your client/boss will not be very happy, if they discover such a situation in the middle of a product showcase/training/demo.
A careful eye may have caught that there is no bigString in the second example. This means that the leak is merely because of the internal scripting object (i.e. the anonymous script onclick='foo()'). This script was not deallocated properly. This caused memory leak at each iteration. To prove our thesis let us run a slightly different test case:
[Exhibit 3 - Leak test without inline script attached]

<html>
<head>
<script type="text/javascript">
    function LeakMemory(){
        for(i = 0; i < 50000; i++){
            var parentDiv =
            document.createElement("div");
        }
    }
</script>
</head>
<body>
<input type="button"
       value="Memory Leaking Insert" onclick="LeakMemory()" />
</body>
</html>
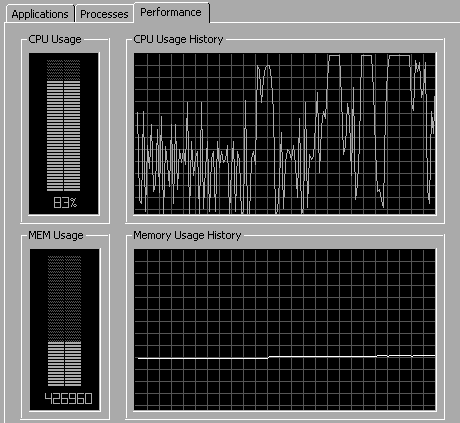
And here follows the corresponding memory graph:

As you can see, we have done fifty thousand iterations instead of 5000, and still the memory usage is flat (i.e. no leaks). The slight ramp is due to some other process in my PC.
Let us change our code in a more standard and somewhat unobtrusive manner (not the correct term here, but can't find a better one) without embedded inline scripts and re-test it.
- JavaScript and memory leaks
- Introducing the closure
- More leakage patterns
- Conclusion
